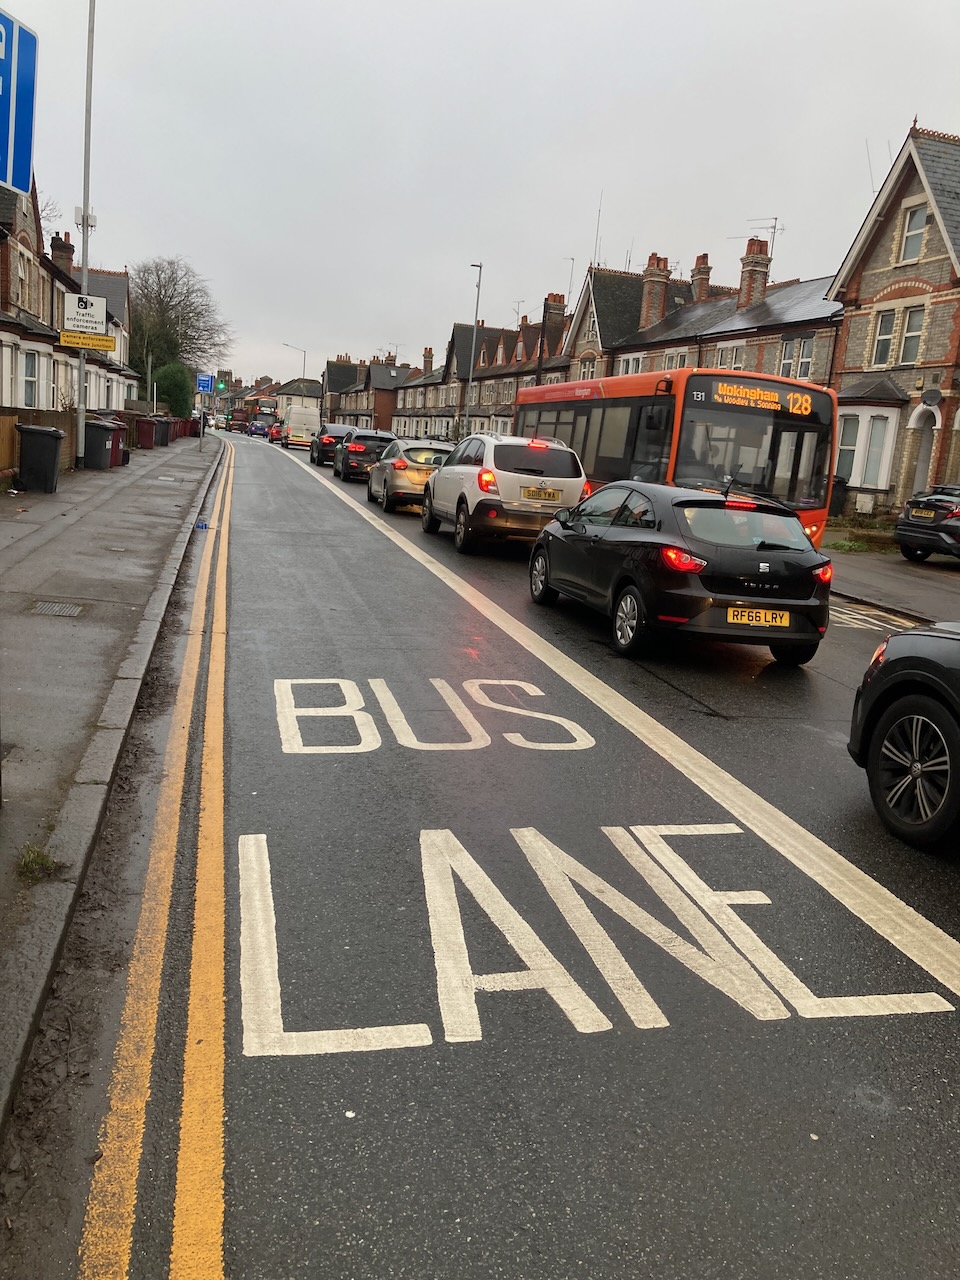
In August 2024 Reading saw a significant change to its transport network. A lane for general traffic on London Road was converted into a bus lane. This caused a bit of a stir, with repeated claims that congestion at the newly introduced pinch point at the start of the bus lane (opposite Liverpool Road) would lead to increased air pollution.
As it happens, an air quality monitoring station is located right next to this supposed bottleneck, just inside Palmer Park. If you were to design an experiment to monitor the effect of the bus lane, you could hardly pick a better location to place a monitor.
The data from this station, as well as many other UK stations, is available from Defra’s website (or using the R package called openair). This means we can now have an in-depth look at the data and determine objectively what has happened at this site.
Air pollution and its causes
The station on London Road monitors PM10 and NOx concentrations. PM10 stands for particulate matter with a diameter of 10 micrometres or less. These are small particles in the air that can pass into the upper airways. They are associated with respiratory disease and cardiovascular effects. NOx stands for nitrogen oxides (NO and NO2). Exposure to NO2 is also linked to an increased risk of disease related mortality.
Both PM10 and NOx are generated in a wide range of human activity, including road transport, industry, energy production and domestic heating. Of the two measured pollutants, NOx is most sensitive to road traffic, with around 65 per cent of the NOx at the roadside originating from road transport.
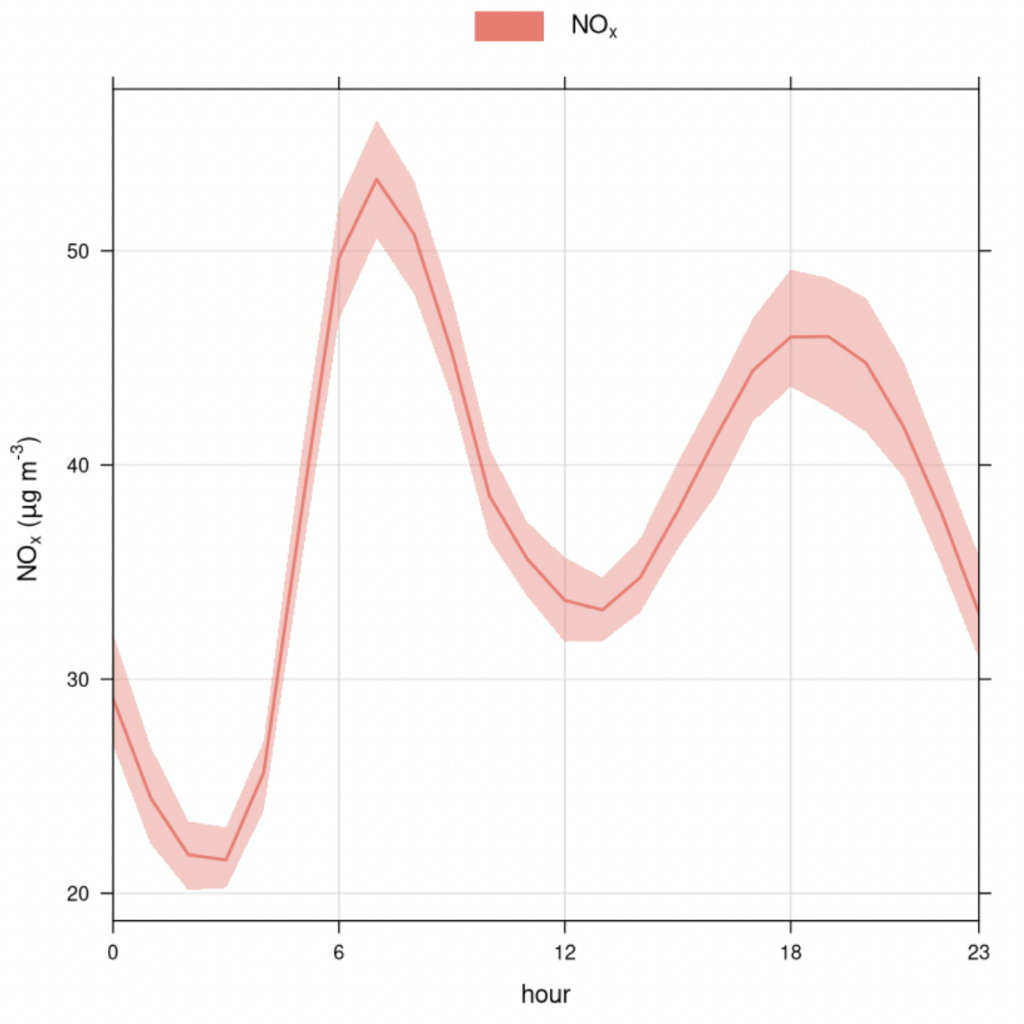
We see this strong influence on London Road as well. The daily variations of NOx show a low of just above 20 μg/m3 at night, shooting up to 50 and higher at peak rush hour.
A look at the data
So what does the data look like in detail? The below image shows the measurements for November 2024.
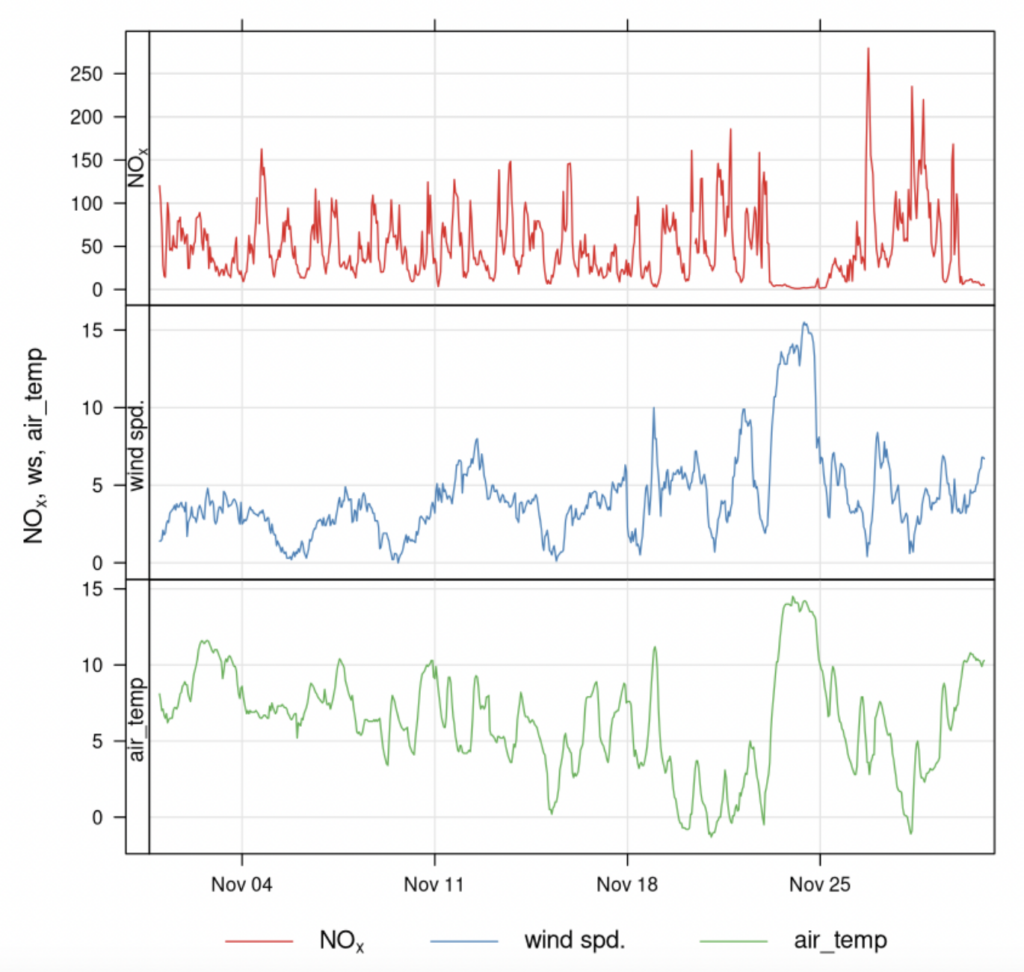
The data gives a very detailed picture, with hourly values of NOx concentrations, wind speeds and air temperature. It is also clear that the data is noisy, showing a lot of variation. We therefore need to look at longer time periods (several months) to get a clear idea of any changes.
We also notice that the weather has a strong influence on pollution. For example, high wind speeds and warmer weather on the days before Nov 25 coincide with a sharp drop in pollution. This well-known influence of weather on air pollution muddies the water, making the influence of road transport less obvious. Is higher air pollution due to more traffic or due to a colder winter? Fortunately, we can use statistical models to estimate the influence of the weather and compensate for it. Here we have used a boosted regression tree approach, as implemented in the R package deweather.
Before and after
The bus lane was only introduced in August, so we’ll only consider the last four mounts of each year (September to December).
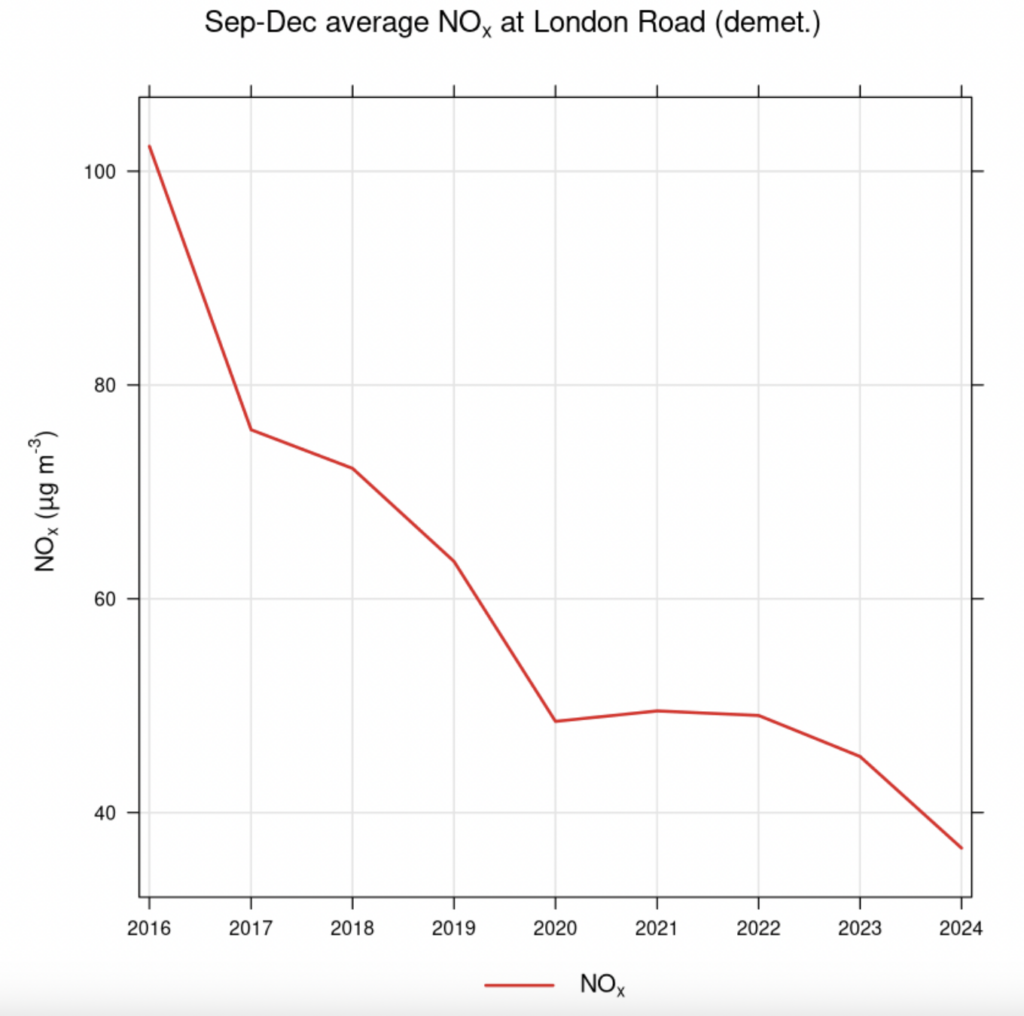
We see that, apart from a post-pandemic bounce-back in 2021, NOx concentrations are steadily declining, likely due to cleaner engines, more electric vehicles and decreasing background concentrations (because of cleaner or reduced industrial activity). A similar trend occurs at other nearby monitoring stations and across the UK. For example, yearly NOx concentrations at Oxford Road have dropped from around 80 μg/m3 in 2016 to 40 μg/m3 in 2024.
Most importantly, the graph shows absolutely no influence from the bus lane introduction in 2024.
It is possible that while air pollution has dropped at the bottleneck, congestion has extended onto the Sutton Seeds roundabout and thus caused air pollution to be more spread out. Google Maps traffic data certainly shows congestion there. It is, however, unclear to what extent this has changed since the bus lane was introduced. There certainly was heavy traffic there before as well (see the Reading Buses account on 𝕏 for past announcements of severe delays on the Orange routes). Reading Borough Council and Reading Buses should have more detailed traffic data on this, which we hope will be made public soon. It should also be noted that population density on the Wokingham side of London Road is a lot lower than on the Reading side and houses are further away from the road, reducing the health impacts of air pollution.
Conclusion
As in many important matters, it is difficult to gauge the impact of a change without good data. Humans are not very good at quantifying air pollution and are subject to all kinds of biases. Although more data would certainly be welcome, this investigation shows that, at least with respect to air quality, we’re certainly not seeing the catastrophic effects some had predicted.
While air quality in Reading is certainly improving, there’s still a lot of work to be done. Because of the strong impact on health, the World Health Organisation has produced air quality guidelines. Their recommendation is to keep yearly averaged NO2 concentrations below 10 μg/m3, PM10 below 15 μg/m3. For 2024, all three roadside monitoring sites in Reading exceeded both thresholds, with the worst offender at Caversham Rd measuring 23.3 μg/m3 for NO2 and 23.1 μg/m3 for PM10.
The council should be applauded for their support for action on air quality: the Clean Air Living Matters and school streets programmes for local shools, improvements to sustainable and active travel, and increasing parking permit fees for more polluting cars.
However, more needs to be done to reduce the air pollution that is affecting the health and development of our children. Census data shows that in Reading more than half of commutes between 2km and 5km are done by car and almost one in three commutes of less than 2km. Many of these journeys could be walked or cycled, but more carrots (cycling infrastructure, reliable public transport) and sticks (road pricing, lower speed limits, blocking through-traffic) should be considered to reclaim our streets.
Finally, to get an idea of what air quality is like at your own home, have a look at addresspollution.org. Caution: the results may cause a desire for radical change. If so, please consider doing some of the following: talk to schools about CALM and school streets, organize a bike bus, respond to council consultations, write your councillors, and of course participate in Kidical Mass rides!
